Navigraph CEO, Magnus Axholt, started off their FSExpo presentation with a quick introduction. He and Stephen O’Connell, CTO, started 10 years ago and have since built a team of 25 to lead the flight simulation hobby in all things charts and navigation data. The program we know and love started as a PDF viewer and is now in the 8th iteration.
They recoded Navigraph with their 8th iteration in order to build a platform that is capable of adding new features at a faster rate. As many of you know, the team recently introduced weather layers to their program – which was the focus of their FSExpo presentation. There are tons of different layers that provide all sorts of data which are relevant to flight planning. We already released an article discussing this new feature which you can check out here. We’ll provide a brief summary below:
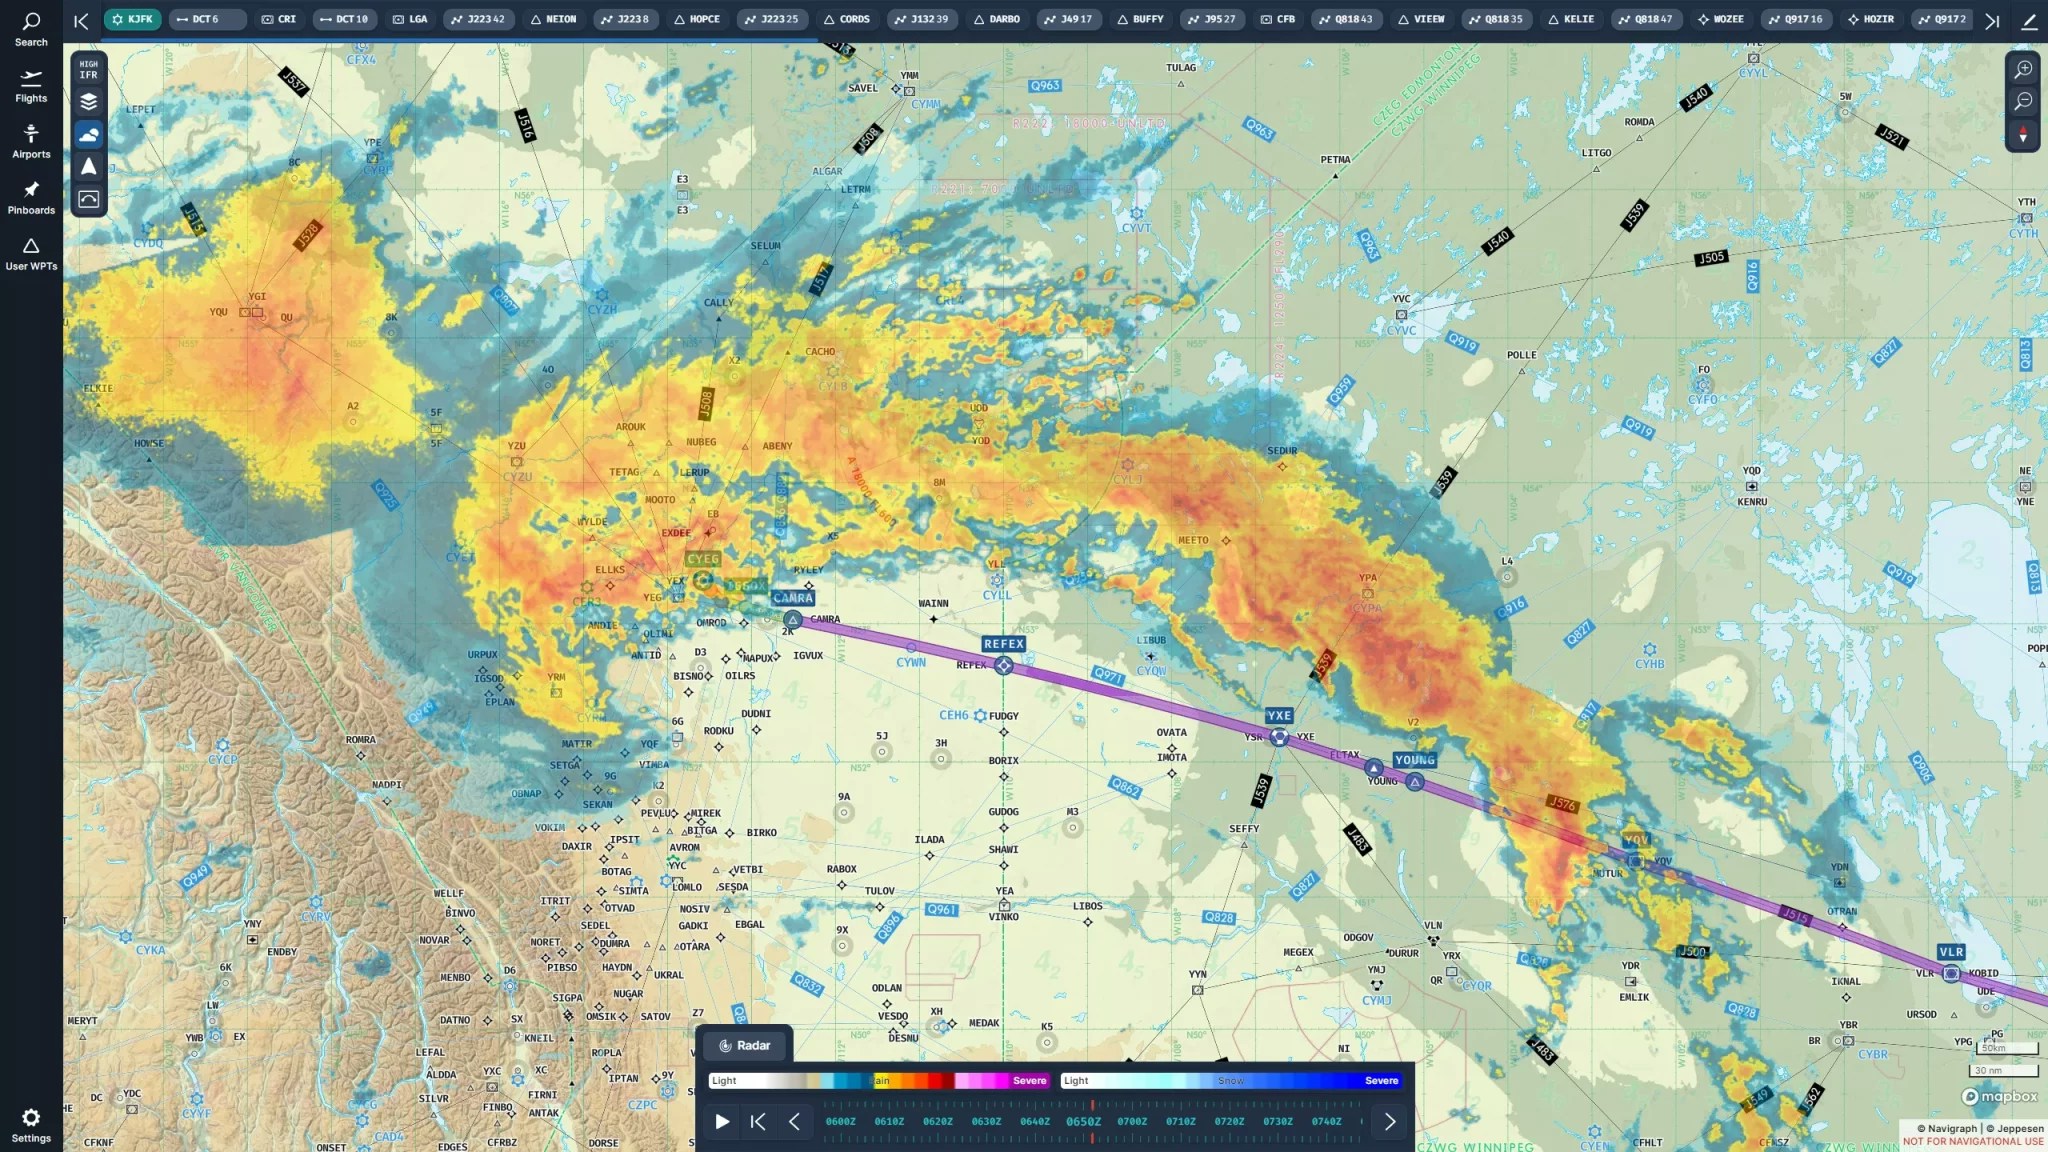
Radar, which is a representation of data collected by, you guessed it, radars.
AIRSIGMET/CWA, which are color coded areas that provide information regarding turbulence, thunderstorms, IFR conditions, etc.
METAR data is also included which is visually presented including color coding for IFR/VFR, icing, and more.
Turbulence provides a visual depiction of how turblulence will affect your planned route.
Icing, which shows icing conditions at various altitudes and intensities.
Reflectivity, which is similar to radar but has greater predictive capabilities that extends past what radar can show.
Cloud cover, which simply shows where clouds are located on the map.
ISA temperature shows different temperatures at various altitudes.
Tropopause, which shows at what altitude the tropopause ends. Many detail-oriented simmers will pay attention to the tropopause altitude as that’s usually where weather will end.
Convective cloud top level, which displays clouds that represent the formation of storms (which we all like to avoid or possibly fly directly into).
High cloud top level displaying the highest portion of the clouds.
Surface visibility displaying data relevant to those of us that want to chase CAT III landing conditions.
MSL (mean sea level) pressure, great for getting a better understanding of atmospheric pressure conditions at the surface.
Jet streams which displays the high speed winds that shaves hours off of trans-Atlantic flights.
Wind barbs showing the strength and direction of wind.